The Voronezh region is a region with an interesting history and great economic and social potential. Successful and sustainable development of any area is human resources. The question arises: what population of the Voronezh region ensures the economic sustainability of the region? Let's look at the characteristics and demographic characteristics of the residents of this area.
Geographical location of the Voronezh region
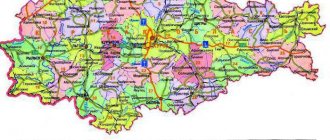
The Voronezh region is located in the center of the East European Plain. Its area is 52 thousand square kilometers, and this is 51st place among all regions of Russia. The region has an extremely convenient location; many transport routes pass through it, connecting various regions of Russia and other countries. The closest neighbors of the Voronezh region are the Rostov, Tambov, Saratov, Kursk, Volgograd, Lipetsk, Belgorod regions and Ukraine. The relief of the region is determined by such objects as the Central Russian and Kalach Uplands and the Oka-Don Plain. The lands here are hilly, with a large number of ravines; most of the territory is occupied by fertile black soil areas. The region is located in an area with a large amount of water resources. The main river of the region is the Don; there are also more than 700 lakes and 1,300 small rivers. Quite favorable living conditions contributed to the fact that people began to settle here quite early, developing the land.
Migration
The Voronezh region is traditionally one of the 15 regions of the Russian Federation that are attractive for migration in the post-Soviet period. The migration growth of the region is provided by both domestic Russian 20% and international migrants 80%. The increase in intra-Russian migration in 2016 amounted to 3,018 people. The region competes quite successfully with Moscow for migration flows from the Lipetsk, Belgorod, Tambov and Rostov regions. But the greatest contribution to the region’s migration growth is made by Ukraine, Uzbekistan, Armenia, Kazakhstan and Moldova. The positive migration balance of the region for many years completely replaces the natural population decline. For example, in 2015, a migration increase of 12,213 people increased the region’s population by 2,330 people. In 2021, a migration increase of 12,546 people increased the total population of the region by 1,931 people, which has a beneficial effect on its economy. However, only in half of the region's districts is there an increase in migration.
| Population of the Altai Territory |
| Population of the Amur region |
| Population of the Arkhangelsk region |
| Population of the Astrakhan region |
| Population of Bashkortostan |
| Population of the Belgorod region |
| Population of the Bryansk region |
| Population of the Vladimir region |
| Population of the Volgograd region |
| Population of the Vologda region |
| Population of Trans-Baikal Territory |
| Population of the Ivanovo region |
| Population of the Irkutsk region |
| Population of Kabardino-Balkaria |
| Population of the Kaluga region |
| Population of Kamchatka Territory |
| Population of Karachay-Cherkessia |
| Population of the Kemerovo region |
| Population of the Kirov region |
| Population of the Kostroma region |
| Population of the Krasnodar Territory |
| Population of the Krasnoyarsk Territory |
| Population of the Kurgan region |
| Population of the Kursk region |
| Population of the Leningrad region |
| Population of the Lipetsk region |
| Population of the Magadan region |
| Population of the Moscow region |
| Population of the Nizhny Novgorod region |
| Population of the Novgorod region |
| Population of the Novosibirsk region |
| Population of the Omsk region |
| Population of the Orenburg region |
| Population of the Oryol region |
| Population of the Penza region |
| Population of Primorsky Krai |
| Population of the Pskov region |
| Population of the Altai Republic |
| Population of the Rostov region |
| Population of the Ryazan region |
| Population of the Samara region |
| Population of the Saratov region |
| Population of the Sakhalin region |
| Population of North Ossetia |
Pino is an online logic game based on tactics and strategy. This is a remix of chess, checkers and corners. The game develops imagination, concentration, teaches how to solve problems, plan your actions and think logically. It doesn’t matter how many chips you have, the main thing is how they are placed!
online intellectual game → 2. Assessment of the level of social development of the Voronezh region.
To assess the level of social development of a subject, it will be most convenient to use such criteria as population size, share of the urban population, and unemployment rate.
Population
In terms of population, the Voronezh region is in 3rd place among the regions of the Central Federal District after Moscow and the Moscow region. 6.6% of the population of the Central Federal District lives in the Voronezh region.
Share of urban and rural population
The share of the urban population of the region as of January 1, 2002 was 62% of the total population of the region, 38% was accounted for by the rural population.
Climate
The Voronezh region is located in the temperate continental climate zone. The average annual temperature in the region is +5 degrees. Summer in the region is warm, sometimes dry; on average, the thermometer in the summer months stays around +20. Winters are quite long, with a lot of snow. The average temperature at this time of year is -9 degrees. There are clear seasonal variations in the region. In general, the seasons in Voronezh coincide with the calendar seasons.
The population of the Voronezh region has long adapted to the weather in the region. All the main observations about it are recorded in national experience in the form of sayings and signs. Although the climate in the region cannot be called the most comfortable for living and farming, it is still quite gentle. Therefore, people began to live here long ago.
Settlement history
The first human settlements on the territory of the modern Voronezh region, according to archaeologists, date back to the Paleolithic period. It is believed that these are the oldest human settlements throughout the territory of modern Russia. Anthropological studies show that 37 thousand years ago people of the Caucasian race lived here.
In the Bronze Age, representatives of the Abashevo culture settled on these lands and were engaged in cattle breeding. In the Iron Age, these territories were in the possession of the Scythians, later they were replaced by the Sarmatians. In the 9th century, Slavic tribes came to the lands of the modern Voronezh region. From the time of the Tatar-Mongol invasion, many mounds and remains of temple buildings remain here. With the cultural and ethnic mixture of Slavic and nomadic cultures, a special subethnic group is emerging here - the Cossacks.
Since the 16th century, the history of the area has been well documented. In 1585, Voronezh was founded as a fortress to protect the borders of the Moscow kingdom. Raids by Tatar tribes continued on these lands until the 17th century, so the inhabitants of the region developed serious military abilities and a special character. During the time of Peter the Great, Voronezh became a provincial city, the territory was actively developed and populated. Since the 18th century, the population of the Voronezh region has been growing steadily. The region took an active part in all Russian wars. During World War II, fierce fighting took place in these lands. In 1957, the Voronezh region acquired its current borders.
National composition[ | ]
The table below includes 54 nationalities, numbering more than 70 people according to the 2010 census. Sorting is based on the latest census.
1939
people[56] | % | 1959 [57] people | % | 1970 [58] people | % | 1979 [59] people | % | 1989 [60] people | % | 2002 [61] people | % from everything | % of those who indicated nationality | 2010 [62][63] people | % from everything | % of those who indicated nationality |
| Total | 3551329 | 100,00 % | 2368740 | 100,00 % | 2526928 | 100,00 % | 2482776 | 100,00 % | 2466661 | 100,00 % | 2378803 | 100,00 % | 2335380 | 100,00 % |
| Russians | 3113269 | 87,66 % | 2172479 | 91,71 % | 2355943 | 93,23 % | 2320418 | 93,46 % | 2304620 | 93,43 % | 2239524 | 94,14 % | 94,62 % | 2124587 | 90,97 % | 95,50 % |
| Ukrainians | 402710 | 11,34 % | 176845 | 7,47 % | 145828 | 5,77 % | 135171 | 5,44 % | 122622 | 4,97 % | 73716 | 3,10 % | 3,11 % | 43054 | 1,84 % | 1,94 % |
| Armenians | 1318 | 0,04 % | 721 | 0,03 % | 855 | 0,03 % | 1115 | 0,04 % | 1865 | 0,08 % | 8813 | 0,37 % | 0,37 % | 10369 | 0,44 % | 0,47 % |
| Gypsies | 1761 | 0,05 % | 2030 | 0,09 % | 1988 | 0,08 % | 2649 | 0,11 % | 3953 | 0,16 % | 4779 | 0,20 % | 0,20 % | 5153 | 0,22 % | 0,23 % |
| Azerbaijanis | 150 | 0,00 % | 199 | 0,01 % | 400 | 0,02 % | 779 | 0,03 % | 3167 | 0,13 % | 4177 | 0,18 % | 0,18 % | 5085 | 0,22 % | 0,23 % |
| Turks | 121 | 0,00 % | 13 | 0,00 % | 20 | 0,00 % | 20 | 0,00 % | 3436 | 0,14 % | 0,15 % | 4210 | 0,18 % | 0,19 % |
| Tatars | 1798 | 0,05 % | 914 | 0,04 % | 1193 | 0,05 % | 1428 | 0,06 % | 1860 | 0,08 % | 3486 | 0,15 % | 0,15 % | 3340 | 0,14 % | 0,15 % |
| Belarusians | 4381 | 0,12 % | 4547 | 0,19 % | 5281 | 0,21 % | 5388 | 0,22 % | 6333 | 0,26 % | 5013 | 0,21 % | 0,21 % | 3261 | 0,14 % | 0,15 % |
| Moldovans | 155 | 0,00 % | 470 | 0,02 % | 830 | 0,03 % | 1039 | 0,04 % | 1206 | 0,05 % | 1400 | 0,06 % | 0,06 % | 2273 | 0,10 % | 0,10 % |
| Uzbeks | 162 | 0,00 % | 83 | 0,00 % | 691 | 0,03 % | 640 | 0,03 % | 1117 | 0,05 % | 977 | 0,04 % | 0,04 % | 1871 | 0,08 % | 0,08 % |
| Tajiks | 30 | 0,00 % | 276 | 0,01 % | 106 | 0,00 % | 480 | 0,02 % | 802 | 0,03 % | 0,03 % | 1571 | 0,07 % | 0,07 % |
| Georgians | 451 | 0,01 % | 251 | 0,01 % | 419 | 0,02 % | 573 | 0,02 % | 1130 | 0,05 % | 1704 | 0,07 % | 0,07 % | 1488 | 0,06 % | 0,07 % |
| Germans | 5361 | 0,15 % | 399 | 0,02 % | 566 | 0,02 % | 687 | 0,03 % | 791 | 0,03 % | 1958 | 0,08 % | 0,08 % | 1431 | 0,06 % | 0,06 % |
| Chuvash | 452 | 0,01 % | 253 | 0,01 % | 665 | 0,03 % | 1290 | 0,05 % | 1875 | 0,08 % | 1705 | 0,07 % | 0,07 % | 1333 | 0,06 % | 0,06 % |
| Chechens | 29 | 0,00 % | 76 | 0,00 % | 134 | 0,01 % | 1598 | 0,06 % | 1815 | 0,08 % | 0,08 % | 1309 | 0,06 % | 0,06 % |
| Jews | 11105 | 0,31 % | 6179 | 0,26 % | 6411 | 0,25 % | 5468 | 0,22 % | 3847 | 0,16 % | 1475 | 0,06 % | 0,06 % | 910 | 0,04 % | 0,04 % |
| Mordva | 961 | 0,03 % | 296 | 0,01 % | 701 | 0,03 % | 1062 | 0,04 % | 1223 | 0,05 % | 1217 | 0,05 % | 0,05 % | 785 | 0,03 % | 0,04 % |
| Ossetians | 145 | 0,00 % | 93 | 0,00 % | 237 | 0,01 % | 350 | 0,01 % | 493 | 0,02 % | 789 | 0,03 % | 0,03 % | 764 | 0,03 % | 0,03 % |
| Koreans | 29 | 0,00 % | 127 | 0,01 % | 164 | 0,01 % | 154 | 0,01 % | 499 | 0,02 % | 0,02 % | 672 | 0,03 % | 0,03 % |
| Dargins | 6 | 0,00 % | 37 | 0,00 % | 29 | 0,00 % | 449 | 0,02 % | 526 | 0,02 % | 0,02 % | 640 | 0,03 % | 0,03 % |
| Kurds | 3 | 0,00 % | 8 | 0,00 % | 4 | 0,00 % | 27 | 0,00 % | 324 | 0,01 % | 0,01 % | 594 | 0,03 % | 0,03 % |
| Lezgins | 82 | 0,00 % | 87 | 0,00 % | 98 | 0,00 % | 571 | 0,02 % | 546 | 0,02 % | 0,02 % | 591 | 0,03 % | 0,03 % |
| Kyrgyz | 65 | 0,00 % | 109 | 0,00 % | 53 | 0,00 % | 328 | 0,01 % | 105 | 0,00 % | 0,00 % | 553 | 0,02 % | 0,02 % |
| Kazakhs | 834 | 0,02 % | 137 | 0,01 % | 366 | 0,01 % | 386 | 0,02 % | 872 | 0,04 % | 378 | 0,02 % | 0,02 % | 510 | 0,02 % | 0,02 % |
| Avars | 9 | 0,00 % | 58 | 0,00 % | 89 | 0,00 % | 523 | 0,02 % | 481 | 0,02 % | 0,02 % | 506 | 0,02 % | 0,02 % |
| Yazidis | 321 | 0,01 % | 0,01 % | 423 | 0,02 % | 0,02 % |
| Tabasarans | 1 | 0,00 % | 7 | 0,00 % | 17 | 0,00 % | 432 | 0,02 % | 394 | 0,02 % | 0,02 % | 414 | 0,02 % | 0,02 % |
| Arabs | 23 | 0,00 % | 19 | 0,00 % | 14 | 0,00 % | 325 | 0,01 % | 0,01 % | 390 | 0,02 % | 0,02 % |
| Greeks | 190 | 0,01 % | 148 | 0,01 % | 246 | 0,01 % | 210 | 0,01 % | 351 | 0,01 % | 450 | 0,02 % | 0,02 % | 373 | 0,02 % | 0,02 % |
| Poles | 1626 | 0,05 % | 729 | 0,03 % | 687 | 0,03 % | 496 | 0,02 % | 474 | 0,02 % | 539 | 0,02 % | 0,02 % | 373 | 0,02 % | 0,02 % |
| Bashkirs | 243 | 0,01 % | 105 | 0,00 % | 127 | 0,01 % | 204 | 0,01 % | 311 | 0,01 % | 400 | 0,02 % | 0,02 % | 352 | 0,02 % | 0,02 % |
| Turkmens | 40 | 0,00 % | 99 | 0,00 % | 313 | 0,01 % | 75 | 0,00 % | 474 | 0,02 % | 221 | 0,01 % | 0,01 % | 302 | 0,01 % | 0,01 % |
| Khemshili | 281 | 0,01 % | 0,01 % | 265 | 0,01 % | 0,01 % |
| Ingush | 14 | 0,00 % | 18 | 0,00 % | 44 | 0,00 % | 102 | 0,00 % | 218 | 0,01 % | 0,01 % | 255 | 0,01 % | 0,01 % |
| Mari | 151 | 0,00 % | 178 | 0,01 % | 282 | 0,01 % | 349 | 0,01 % | 336 | 0,01 % | 0,01 % | 253 | 0,01 % | 0,01 % |
| Gagauz | 51 | 0,00 % | 54 | 0,00 % | 108 | 0,00 % | 185 | 0,01 % | 0,01 % | 251 | 0,01 % | 0,01 % |
| Kumyks | 9 | 0,00 % | 32 | 0,00 % | 31 | 0,00 % | 281 | 0,01 % | 207 | 0,01 % | 0,01 % | 234 | 0,01 % | 0,01 % |
| Bulgarians | 63 | 0,00 % | 123 | 0,00 % | 123 | 0,00 % | 175 | 0,01 % | 250 | 0,01 % | 0,01 % | 225 | 0,01 % | 0,01 % |
| Vietnamese | 107 | 0,00 % | 1 | 0,00 % | 1 | 0,00 % | 140 | 0,01 % | 0,01 % | 210 | 0,01 % | 0,01 % |
| Udmurts | 183 | 0,01 % | 193 | 0,01 % | 236 | 0,01 % | 355 | 0,01 % | 313 | 0,01 % | 0,01 % | 199 | 0,01 % | 0,01 % |
| Chinese | 77 | 0,00 % | 25 | 0,00 % | 14 | 0,00 % | 10 | 0,00 % | 151 | 0,01 % | 0,01 % | 187 | 0,01 % | 0,01 % |
| Lithuanians | 189 | 0,01 % | 159 | 0,01 % | 227 | 0,01 % | 263 | 0,01 % | 385 | 0,02 % | 225 | 0,01 % | 0,01 % | 171 | 0,01 % | 0,01 % |
| Abkhazians | 5 | 0,00 % | 24 | 0,00 % | 17 | 0,00 % | 53 | 0,00 % | 121 | 0,01 % | 0,01 % | 148 | 0,01 % | 0,01 % |
| Kabardians | 38 | 0,00 % | 38 | 0,00 % | 47 | 0,00 % | 64 | 0,00 % | 83 | 0,00 % | 0,00 % | 140 | 0,01 % | 0,01 % |
| Karachais | 6 | 0,00 % | 53 | 0,00 % | 33 | 0,00 % | 56 | 0,00 % | 103 | 0,00 % | 0,00 % | 125 | 0,01 % | 0,01 % |
| Aguly | 2 | 0,00 % | 1 | 0,00 % | 48 | 0,00 % | 76 | 0,00 % | 0,00 % | 118 | 0,00 % | 0,00 % |
| Laktsy | 20 | 0,00 % | 28 | 0,00 % | 18 | 0,00 % | 102 | 0,00 % | 70 | 0,00 % | 0,00 % | 107 | 0,00 % | 0,00 % |
| Latvians | 505 | 0,01 % | 189 | 0,01 % | 181 | 0,01 % | 440 | 0,02 % | 157 | 0,01 % | 139 | 0,01 % | 0,01 % | 102 | 0,00 % | 0,00 % |
| Nogais | 7 | 0,00 % | 3 | 0,00 % | 19 | 0,00 % | 72 | 0,00 % | 88 | 0,00 % | 0,00 % | 99 | 0,00 % | 0,00 % |
| Komi | 225 | 0,01 % | 96 | 0,00 % | 116 | 0,00 % | 142 | 0,01 % | 141 | 0,01 % | 0,01 % | 95 | 0,00 % | 0,00 % |
| Assyrians | 245 | 0,01 % | 148 | 0,01 % | 148 | 0,01 % | 105 | 0,00 % | 83 | 0,00 % | 95 | 0,00 % | 0,00 % | 91 | 0,00 % | 0,00 % |
| Meskhetian Turks | 88 | 0,00 % | 0,00 % | 86 | 0,00 % | 0,00 % |
| Buryats | 103 | 0,00 % | 15 | 0,00 % | 22 | 0,00 % | 25 | 0,00 % | 50 | 0,00 % | 0,00 % | 79 | 0,00 % | 0,00 % |
| Estonians | 248 | 0,01 % | 113 | 0,00 % | 134 | 0,01 % | 159 | 0,01 % | 109 | 0,00 % | 95 | 0,00 % | 0,00 % | 73 | 0,00 % | 0,00 % |
| other | 963 | 0,03 % | 1115 | 0,05 % | 684[64] | 0,03 % | 590 | 0,02 % | 789 | 0,03 % | 1196 | 0,05 % | 0,05 % | 1641 | 0,07 % | 0,07 % |
| indicating nationality | 3550538 | 99,98 % | 2368701 | 100,00 % | 2482776 | 100,00 % | 2466646 | 100,00 % | 2366946 | 99,50 % | 2224631 | 95,26 % |
| did not indicate nationality | 791 | 0,02 % | 39 | 0,00 % | 0 | 15 | 0,00 % | 11857 | 0,50 % | 110749 | 4,74 % |
Population dynamics
Regular observations of the number of inhabitants of the region begin in 1897. The frequency of measurements varied, but they make it possible to see that the population of the Voronezh region was almost always relatively stable. Only at the turn of the 19th and 20th centuries was there a sharp increase in the number of inhabitants; this was not due to changes in demographic indicators, but to the redistribution of land between regions. After the Second World War, for obvious reasons, the number of inhabitants decreased by as much as a million. During Soviet times, there were fluctuations in numbers: from 2.3 million people in 1959 to 2.5 million in 1970.
During the period of perestroika, slight changes in the number of residents of the region were noticed: approximately several thousand people, both positive and negative. In the 21st century, the population of the region is generally declining. Only in 2010 and 2015 were positive dynamics noted. Today the population of the Voronezh region is 2 million 333 thousand people.
Foundation of the city
The first written mention of the city dates back to 1585, in the entry of the Discharge Order it is written about the allocation of boarding and fishing places to the new city of Voronezh. Which proves the existence of a settlement during these years. Nevertheless, the official date of foundation is considered to be 1586, when the fortress was cut down from wood, which was built under the leadership of the first city governor, Semyon Fedorovich Saburov. What the population of the city of Voronezh was in those ancient times has not been established for certain.
In 1590, the city and the fortress were burned by the Cherkasy people, but everything was restored by 1594. In 1613, plows began to be built in the city, which were then used to deliver salaries to the Don Cossacks. In 1615, the population of Voronezh was 7,000 people. Then the number of inhabitants sharply decreased, which was associated with numerous Tatar raids that ravaged the surrounding area.
Ethnic composition and language
The main nationality of the region's residents is Russian. According to the 2010 census, the region is home to 90% of people who consider themselves Russian. The number of other ethnic groups is distributed as follows: Ukrainians - about 2%, Armenians - 0.4%, Uzbeks and Tajiks in total about 0.15%, other nationalities - less than 1% each. Despite the fact that most of the inhabitants of the region call themselves Russians, there is a great influence of the Ukrainian nation in the language, the nature of buildings, and customs. The region is the place of formation of a special southern branch of the Russian people. A significant role in this is played by the culture of the Cossacks, which assimilates Russian and Ukrainian cultures. Some time ago, an increase in the flow of migrants from Central Asia was observed in the region, but today these processes do not have a significant impact on the ethnic composition of the population. However, the migration increase in the region is quite high, amounting to 13 thousand people annually.
Marine base
Only by 1637, after the start of the construction of the Belgorod Line (defensive fortifications) on the southern borders, was it possible to defend against the raids of nomads. In 1676, the city had a population of 5,000. In 1696, the Voronezh Admiralty was created and the construction of a fleet began. Many shipbuilding specialists and forced peasants came to the city. By 1777, the city had developed trade and industry, including 19 factories (13 lard factories, tanneries, candle factories, and others) and 13 cloth factories.
Before the War of 1812, the population of Voronezh was 22,100 people. In subsequent years, the development of industry and increased mobility of the population due to the abolition of serfdom led to a significant influx of peasants. In 1897, the city had a population of 80,599.
Population distribution
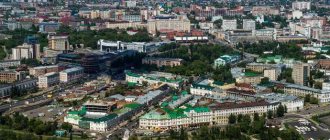
Most of the region's residents live in cities, and the trend toward urban population growth continues. Today, 67% of people in this federal subject live in cities. If we evaluate the cities of the Voronezh region by population, then the capital will be the largest - it has a little more than 1 million people. The remaining cities are significantly smaller in population. There are only 3 settlements in the region with a population of more than 50 thousand people: Rossosh, Liski and Borisoglebsk. From 20 to 35 thousand inhabitants are recorded in 7 cities. These settlements are gradually growing, drawing residents from nearby villages. Thus, the population of Pavlovsk, Voronezh region, with a total population of 25 thousand people per year, is growing by more than 500 people. The region is experiencing a slow decline in rural settlements.
general information
The city is located on the banks of the Voronezh River, near its confluence with the Don, and is the administrative center of the Voronezh region and urban district. It is 463 km away from the capital. The population of Voronezh and its agglomeration is more than 1.3 million people, as of January 1, 2021.
In Voronezh, the first ships of the regular Russian Navy were built and the first airborne units were formed.
Age characteristics of the population
The age differentiation of the region's population is as follows:
- the number of residents under the age of 15 years is 330 thousand people;
- working population – 1 million 375 thousand people;
- the population over working age is 626 thousand people.
This age differentiation suggests that each able-bodied resident of the region must provide for another 0.8 people besides himself, which is a very high indicator of the demographic burden.
Demographic characteristics
Fertility is the most important criterion for assessing the socio-economic development of a region. In the Voronezh region it is 11 people for every thousand inhabitants. In recent years, this figure has been growing slightly, by 0.2 people per year. But the necessary and noticeable increase in the birth rate is not observed. Mortality, on the contrary, shows growth dynamics; approximately 15.7 people have died in recent years. for every thousand inhabitants. Although in terms of mortality, when considering a longer period, the situation improves. The number of deaths has decreased over 10 years by 3 people per thousand inhabitants. But so far the mortality rate is outpacing the birth rate. At the same time, the population of the cities of the Voronezh region is characterized by a low birth rate and rising mortality, and the growth of cities occurs exclusively due to migration.
Life expectancy, another indicator of the socio-economic well-being of the region, is growing in the Voronezh region. It averages 70.1 years, for men – 64.7, for women – 77.1. According to this indicator, the Voronezh region ranks 25th in Russia, which is very good.
Modern times
In the post-war years, evacuated enterprises returned to the city, including aircraft manufacturing and diesel locomotive repair plants. New industrial enterprises were built. The population of the city of Voronezh in 1950 grew to 400,000 people.
In subsequent decades, the city developed dynamically, the territory was improved, and new microdistricts were built. By the end of the 60s, the aircraft plant began producing the supersonic passenger aircraft TU-144, then IL-86. The population of Voronezh in 1975 reached 749,000 people. In the last decades of Soviet power, the number of residents continued to grow dynamically; in 1992, 902,000 people lived here.
In 2004, the Sozvezdie concern was created, now one of the top 100 military-industrial companies in the world in terms of sales. In 2012, the number of city residents reached 1 million people. In subsequent years, the population of Voronezh continued to grow. In 2021 it reached 1,039,801 residents.
